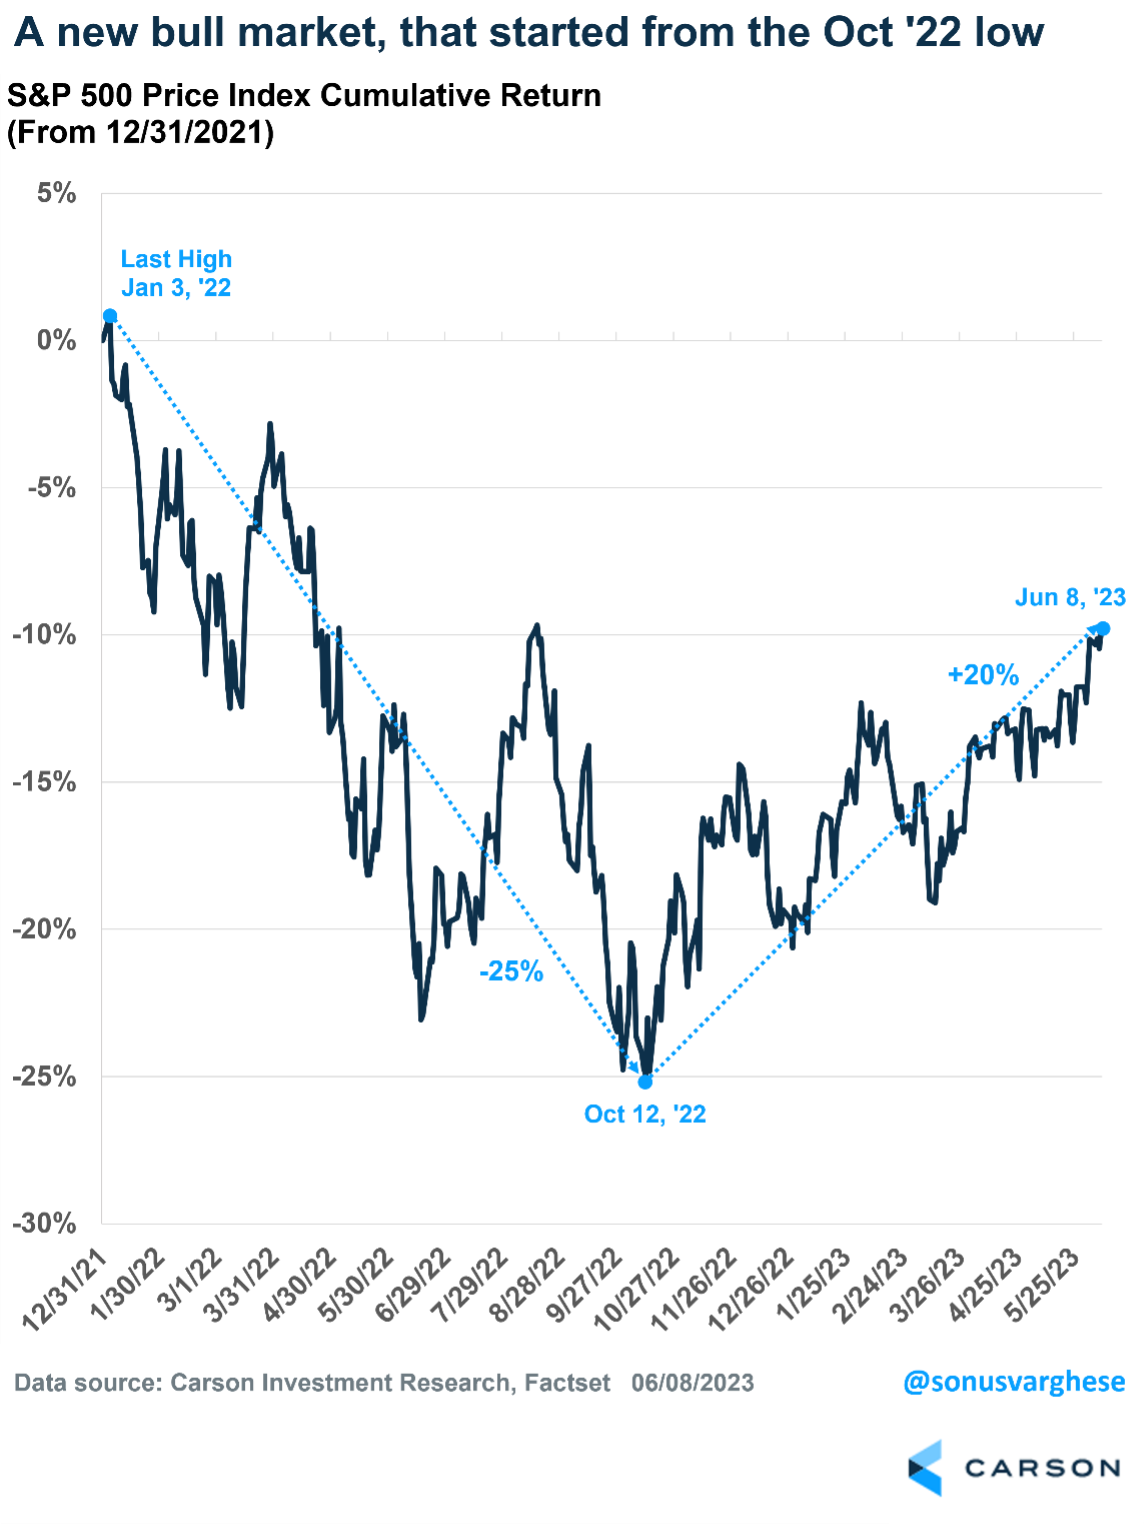
The market’s impressive run off the October lows continued last week. The S&P 500 officially closed up more than 20% from its low set on Oct. 12. In the face of continued skepticism, stocks have progressively moved higher. Now with stocks up 20%, they have officially entered a new bull market and the 2022 bear is over.
- Stocks have officially entered a new bull market, increasing the odds of continued strength.
- Carson’s leading economic index indicates the economy is not in a recession.
- The challenges encountered last year, such as Federal Reserve policy, housing, and business activity, may no longer be headwinds.
At Carson, we aren’t crazy about this definition of a bull market. We’ve believed for a while now that the bear market ended in October, but the financial media prefer the 20% definition. The bottom line is many bears have been proven wrong, as the economy continued to surprise to the upside, inflation came back to earth, and overall earnings estimates increased.
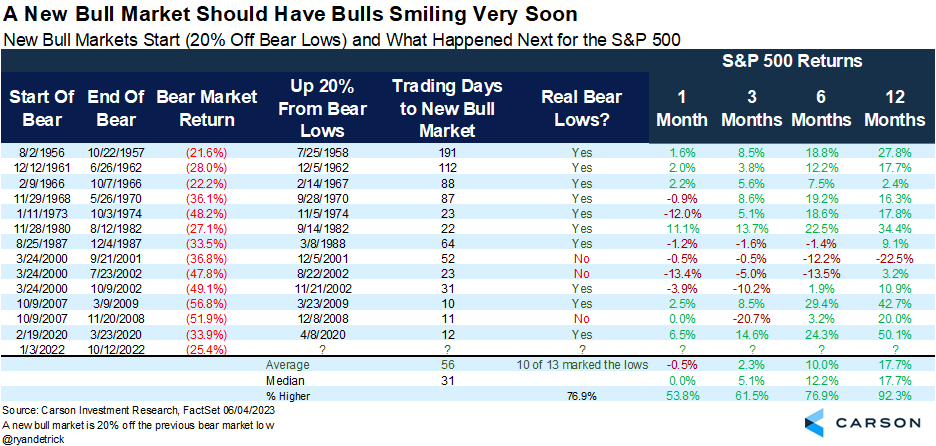
What now? That’s a logical question, and the good news is once stocks are up 20% off the lows, we’ve found that continued strength is quite normal. In fact, since 1956 the S&P 500 has been higher 12 times and up a very impressive 17.7% on average one year after a 20% bounce. The only time stocks were down was during the vicious early 2000s tech bubble bear market.
Taking it one step further, new lows were made after the market rose 20% only three times, while the lows held 10 times. We found there were two times during the tech bubble that stocks gained 20% and again moved to new lows, and it also happened during the global financial crisis of 2007-2009. Fortunately, conditions are not at all similar now to those very bleak times, likely suggesting the October lows will not be violated.
We’ve been in the bullish camp all year, expecting better times and returns. Our view has played out nicely so far in 2023, and we expect this strength to continue the rest of the year, if not beyond.
Our Leading Economic Index (LEI) Says the Economy is Not in a Recession
We have long believed the economy can avoid a recession this year, as we wrote in our 2023 outlook. This has run contrary to most economists’ predictions. Interestingly, the tide has been shifting recently, as a string of relatively stronger economic data has been reported. More so after the latest payrolls data, which surprised again.
One challenge with economic data is we get so many reports, and they can often send conflicting signals. It can be hard to parse through it all and come up with an updated view of the economy after every data release.
One approach is to combine these into a single indicator, i.e., a leading economic index (LEI). It’s “leading” because it provides an early warning signal about economic turning points.
Simply put, the LEI indicates what the economy is doing today and is likely to do soon.
One of the most widely used LEIs is released by The Conference Board, and it currently points to recession. This LEI is down 8% year-over-year, signaling a recession over the next 12 months. It’s been pointing to a recession since last fall, with the index declining for 13 straight months through April.
However, we’re close to mid-2023 and there’s no sign of a recession yet.
This popular LEI is premised on the manufacturing sector and business activity/sentiment being leading indicators of the economy. It contains 10 major components, with more than half geared toward the manufacturing sector. This worked well in the past but is probably not indicative of what’s happening in the economy right now, considering the manufacturing sector makes up about 11% of GDP, while consumption makes up 68% of the economy.
We believe our proprietary leading economic index better captures the dynamics of the U.S. economy. It was developed a decade ago and is a key input into our asset allocation decisions.
In contrast to The Conference Board’s measure, it includes 20-plus components, including,
- Consumer-related indicators (50%)
- Housing activity (18%)
- Business and manufacturing activity (23%)
- Financial markets (9%)
As an example, the consumer-related data includes unemployment benefit claims, weekly hours worked, and vehicle sales. Housing includes indicators such as building permits and new home sales.
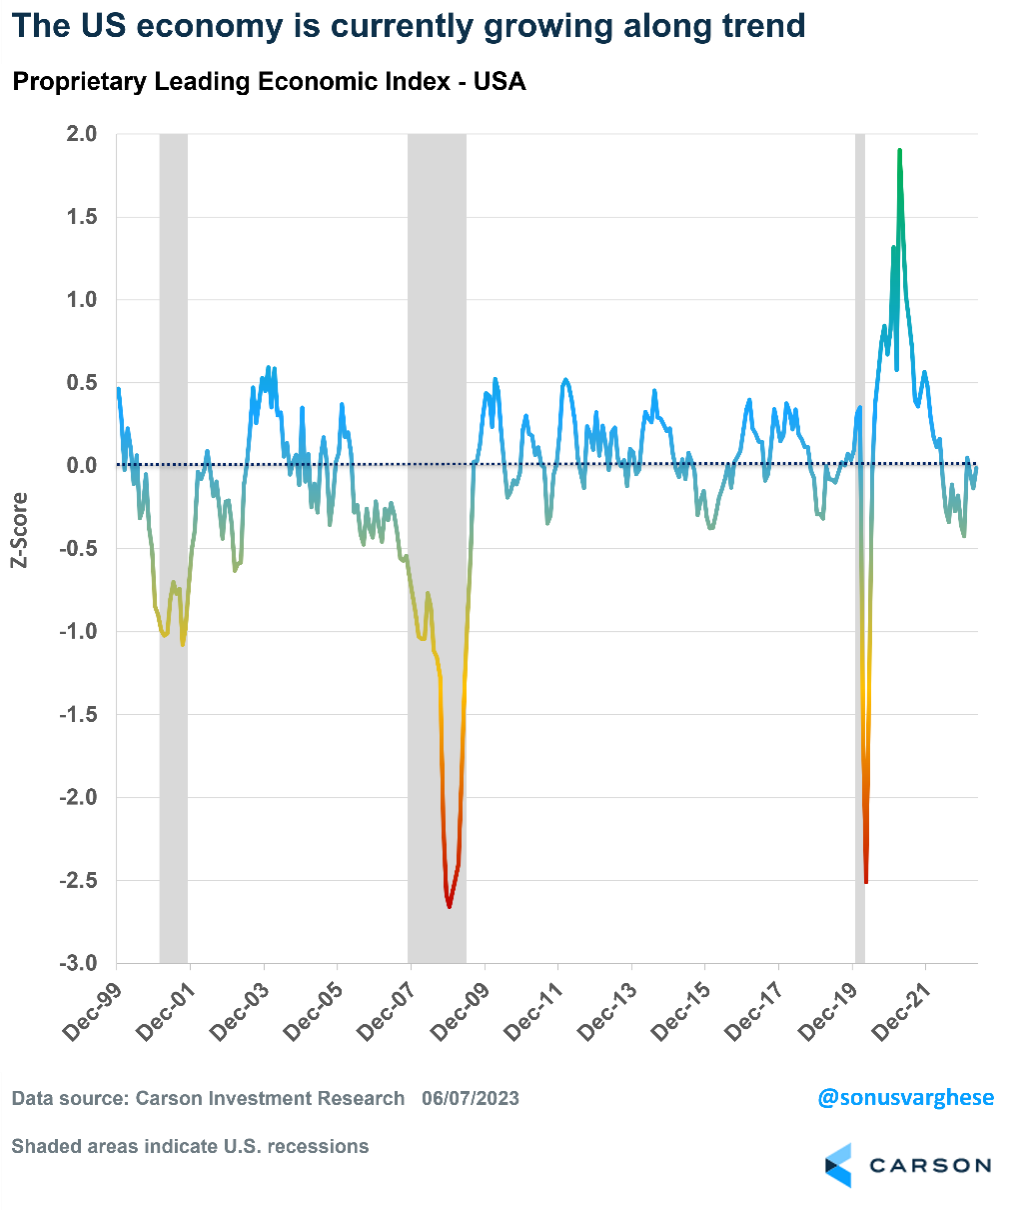
The chart below shows how our LEI has moved through time — capturing whether the economy is growing below trend, on trend (a value close to zero), or above trend. Like The Conference Board’s measure, it can capture major turning points in the business cycle. It declined ahead of the actual start of the 2001 and 2008 recessions.
As of April, our index is indicating that the economy is growing right along trend.
Last year, the index signaled that the economy was growing below trend and the recession risk was high.
Note that it didn’t point to an actual recession, just that the risk of one was higher than normal. In fact, our LEI held close to the lows seen over the last decade, especially in 2011 and 2016, after which the economy and the stock market recovered.
Headwinds No Longer
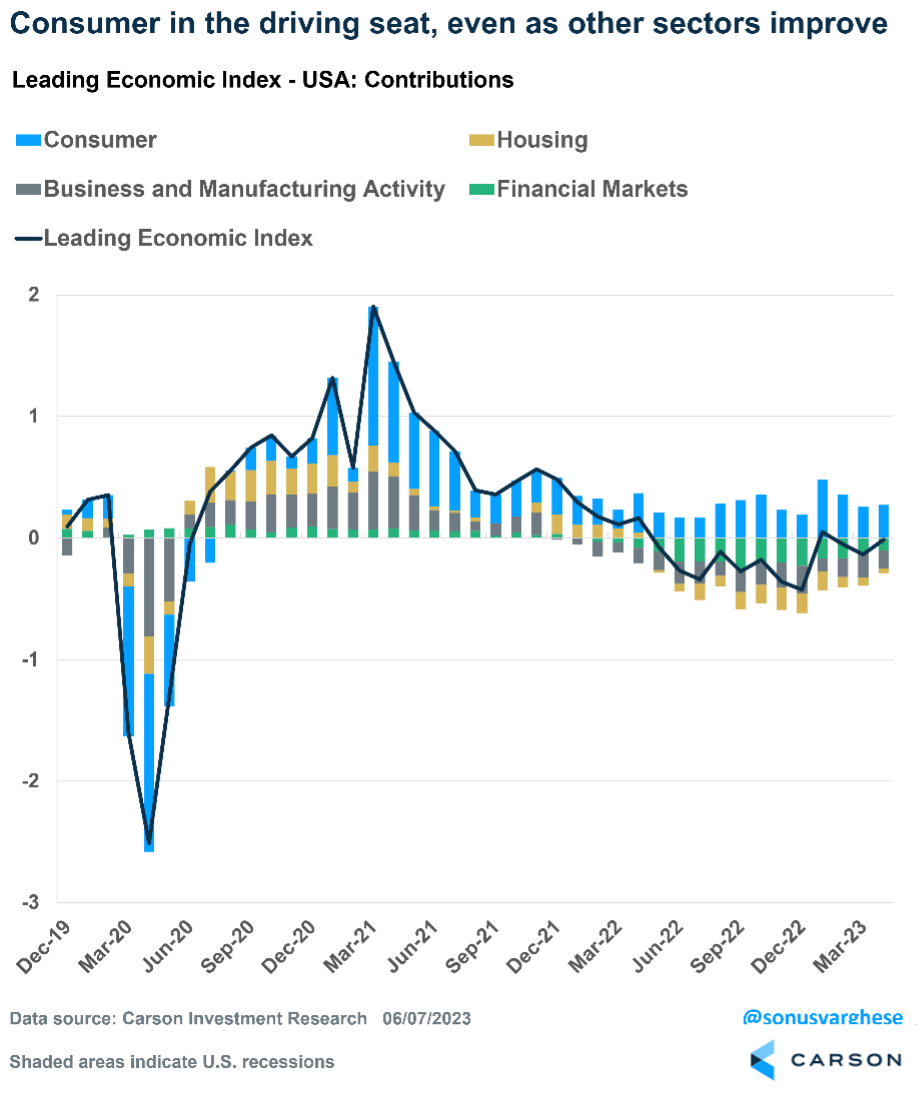
The following chart captures a close-up view of the last three and a half years, which includes the COVID-19 pullback and subsequent recovery. The contribution from the four major categories is also shown. It is clear how the consumer has remained strong over the past year. In fact, consumer indicators have been stronger this year than in late 2022.
The main risk of a recession last year was due to the Federal Reserve raising rates as fast as it did, which adversely impacted housing, financial markets, and business activity.
The good news is these sectors are improving even as consumer strength continues. The recovery in housing is notable. Additionally, the drag from financial conditions is beginning to ease as the Fed gets closer to the end of rate hikes.
So, there’s much to be optimistic about.
This newsletter was written and produced by CWM, LLC. Content in this material is for general information only and not intended to provide specific advice or recommendations for any individual. All performance referenced is historical and is no guarantee of future results. All indices are unmanaged and may not be invested into directly. The views stated in this letter are not necessarily the opinion of any other named entity and should not be construed directly or indirectly as an offer to buy or sell any securities mentioned herein. Due to volatility within the markets mentioned, opinions are subject to change without notice. Information is based on sources believed to be reliable; however, their accuracy or completeness cannot be guaranteed. Past performance does not guarantee future results.
S&P 500 – A capitalization-weighted index of 500 stocks designed to measure performance of the broad domestic economy through changes in the aggregate market value of 500 stocks representing all major industries.
The NASDAQ 100 Index is a stock index of the 100 largest companies by market capitalization traded on NASDAQ Stock Market. The NASDAQ 100 Index includes publicly-traded companies from most sectors in the global economy, the major exception being financial services.
A diversified portfolio does not assure a profit or protect against loss in a declining market.
Compliance Case # 01795338


