Surprisingly, stocks continue to trend higher in the face of a constant barrage of negative news in the media. As we explain more below, the economy is presenting many positive signs that suggest a recession is unlikely, and stocks likely are sniffing this out. In fact, last Thursday the S&P 500 set another new high for 2023, up more than 9% for the year. Meanwhile, tech stocks continue to perform well, with the NASDAQ-100 setting a new 52-week high for the first time in nearly 18 months.
- The S&P 500 hit a new 2023 high last week, not quite reaching the key 4,200 mark.
- Stocks have gained during May in nine of the past 10 years.
- Economic data continues to come in strong, including for retail sales and vehicle production.
- Housing starts and permits data are turning around as builders become more confident about the economic outlook.
- Housing may no longer be a drag on economic growth the rest of this year.
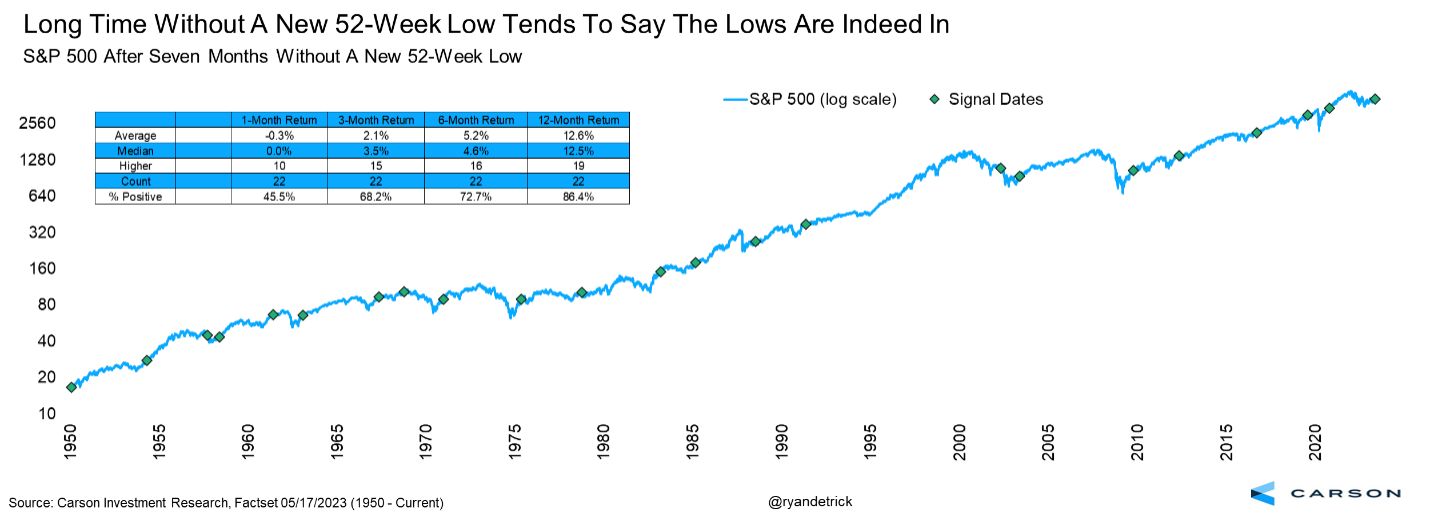
At Carson, we’ve been one of the few firms to believe the bear market ended in October. May marks seven months without a new low, which greatly improves the odds that stocks have bottomed and higher prices are coming. In fact, previous times the S&P 500 made a new 52-week low (like last October) then went seven months without a new low showed strong future returns. The S&P 500 was higher one year later 19 out of 22 times and up a very solid 12.6% on average. Since 1970, stocks in this scenario made new lows only twice out of 14 times. Those new lows took place in 2002 before a generational three-year bear market and before the COVID-induced bear market and a 100-year pandemic.
The Leading Indicator That’s Pointing Away From a Recession
It’s hard to get away from continued recession calls, even as several data points, such as the examples below, suggest the opposite:
- Employment is running strong.
- Retail sales rebounded in April.
- Manufacturing, especially vehicle production, is turning around.
- The housing market is showing signs of recovery.
Let’s focus on housing. Residential investment makes up under 5% of the economy, but it’s been a drag on economic growth for eight straight quarters. Over the four quarters through the first quarter of 2023, real GDP grew about 1.6%. But that’s after accounting for a significant 0.6-0.7% drag from residential investment.
The cause shouldn’t be a surprise. The Federal Reserve began its most aggressive policy-tightening cycle in 40-plus years, as it attempted to curb inflation. That sent mortgage rates from 3% to 7% in less than a year, freezing the housing market. Affordability collapsed due to higher rates and elevated home prices.
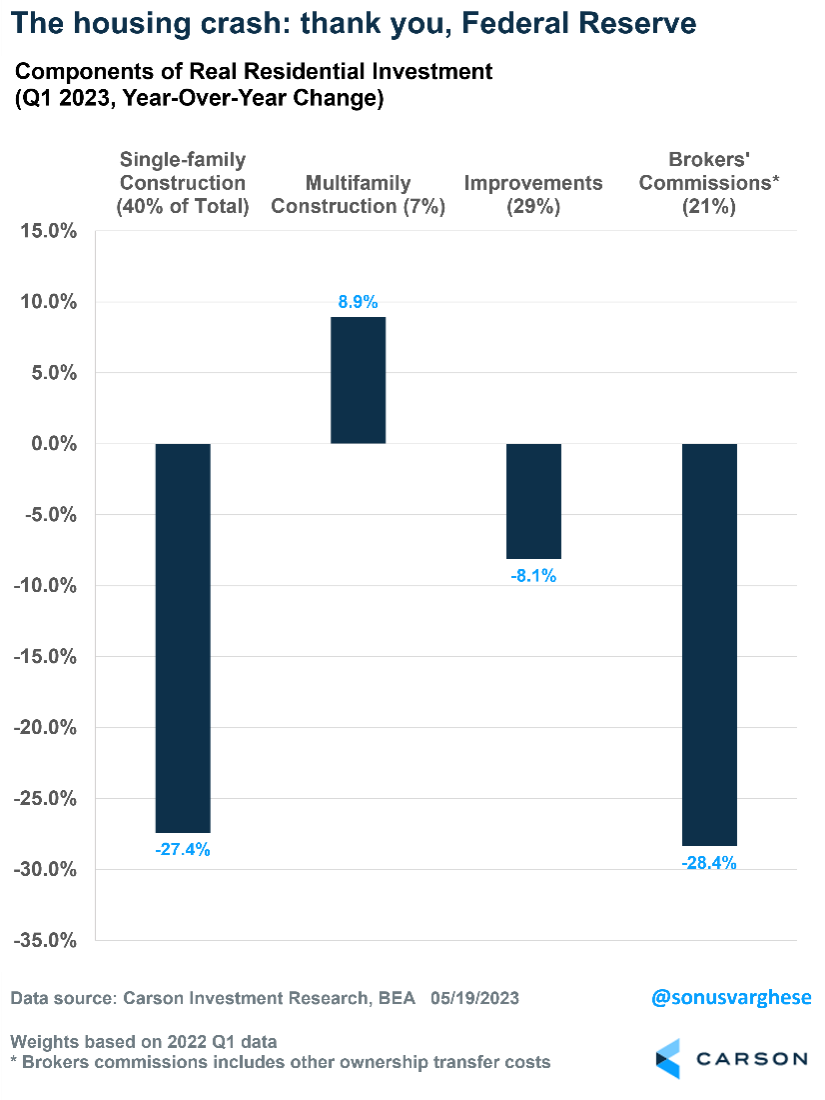
Amid decreasing demand, builders reduced their involvement in new construction projects. As a result, there was a notable 27% decline in single-family construction, which comprises approximately 40% of residential investment in GDP. Brokers’ commissions, accounting for just over 20% of residential investment, experienced a 28% decrease due to a significant drop in sales activity. Home improvements also fell, primarily because many households had already completed their projects during the 2020-2021 pandemic period. The sole positive aspect within the housing sector was the continued strength in multifamily construction.
Declining Housing Activity Has Foreshadowed Past Recessions
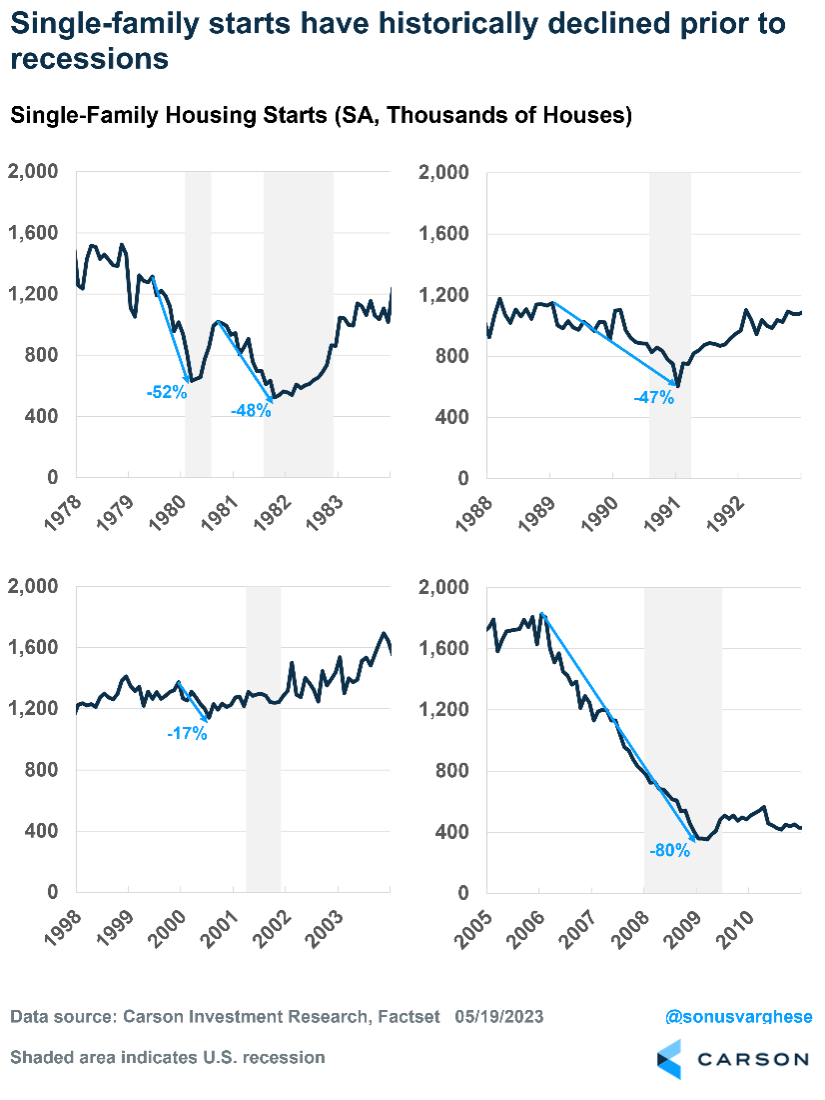
Between 1980 and 2010, the U.S. experienced five recessions, and each was preceded by a huge decline in single-family housing starts, which is a measure of construction starts on new residential units. This precedes sales of new homes as well as spending on appliances, furniture, and other home goods. It provides insight into builders’ sentiment for investing in new projects and how consumers view their personal financial situations, since buying a house a is big financial commitment.
That’s why it’s an important metric for gauging where the economy is headed.
We reviewed single-family housing starts across the five recessions that preceded the pandemic-led 2020 recession, including 1980, 1981-1982, 1990-1991, 2001, and 2007-2009. As the chart below shows, single-family starts declined significantly prior to each of those recessions, which were typically preceded by aggressive Fed tightening.
The mildest decline was in 2000, when starts declined “only” 17%. The 1999-2000 period saw the Fed raise the federal funds rate by about 1.75%. The other periods saw rates go up by 4.0% or more.
Here’s what’s interesting. The chart also shows that housing historically bottomed prior to the end of a recession and has typically led the economy out of one. It also generally coincided with the Fed reducing interest rates in response to a slowing economy.
That brings us to the current cycle.
A Turnaround Begins
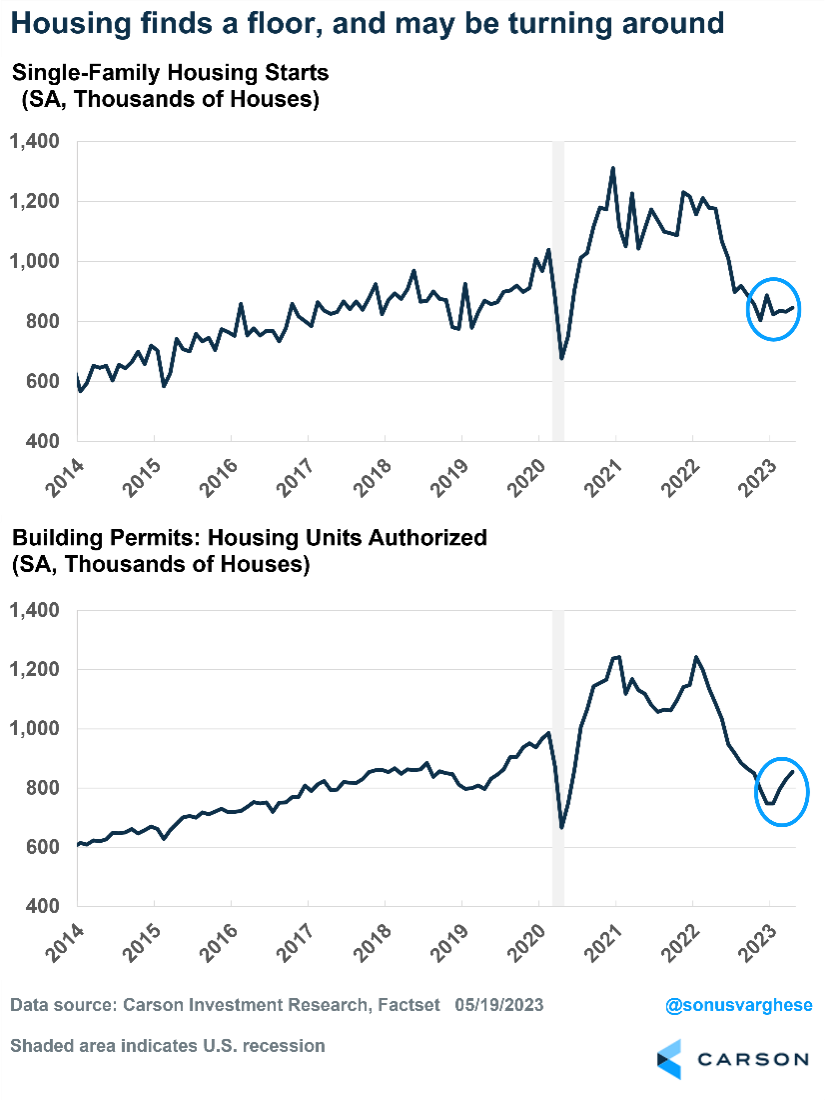
The chart below shows single-family housing starts and permits. Permits count authorized permits to build new housing units and are a leading indicator of future supply.
Thanks to aggressive Fed rate hikes, single-family starts crashed 35% over the 12 months through November 2022. Permits plunged 40% over the 11 months through December 2022. No wonder residential investment was such a big drag on economic growth. However, unlike what we saw in the past, the economy was able to avoid a recession.
And now there’s good news. Starts and permits appear to be turning around. Starts are up 5% since November 2022, while permits have already increased 14% over the three months through April.
Builders Are Feeling Better About the Housing Market
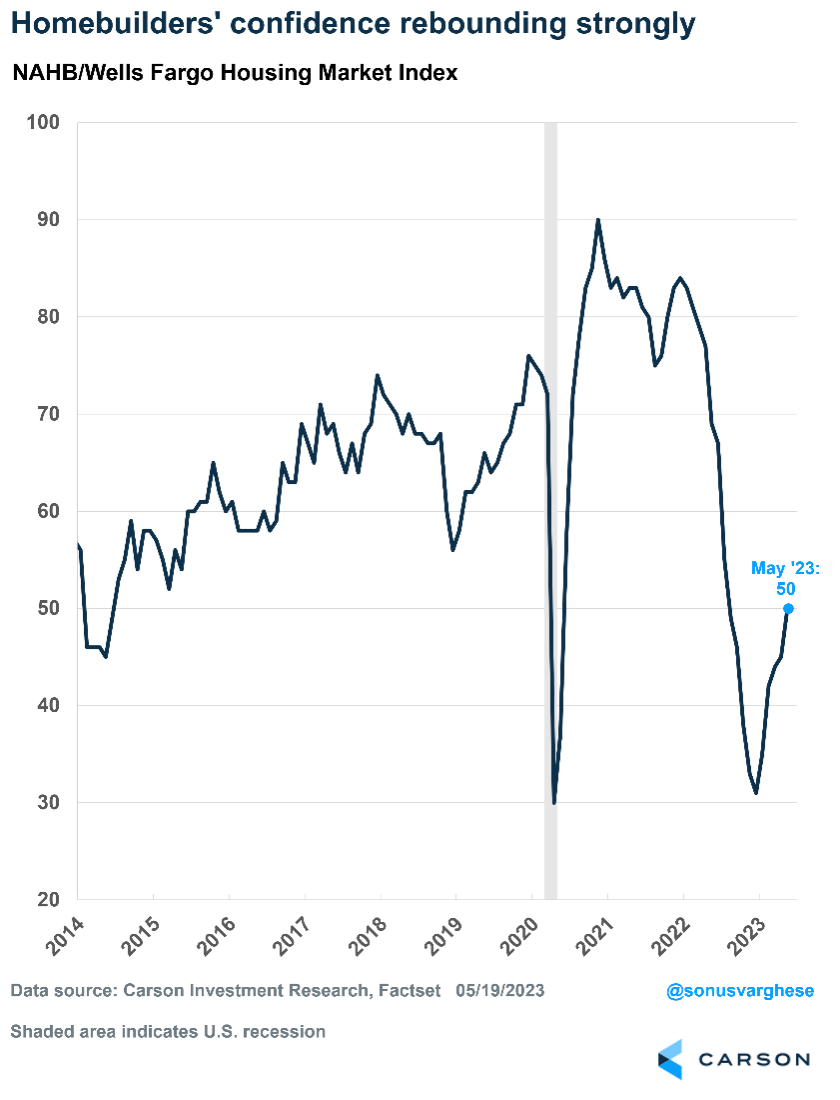
Builders’ confidence in the housing market is growing. Since the start of 2023, the NAHB Housing Market Index, a gauge of builders’ confidence, has been steadily recovering. It’s still a ways out from pre-crash levels, but the upward trend is encouraging.
Here’s a summary of housing trends:
Due to high mortgage rates, most homeowners, who either bought their homes or refinanced at low rates, are “locked in.” So, inventory is low in the existing home sales market. However, there’s a lot of pent-up demand due to a record number of people ages 25-34, which is prime homebuying age. These potential homebuyers are being pushed into the new homes market. That is positive for builders and the economy, since new home demand matters for economic growth.
A final point to underline this data: The SPDR S&P Homebuilders ETF, which is a basket of homebuilder stocks, just hit a new 52-week high and is at its highest level since February 2022. The ETF is up more than 19% this year through May 19. Investors are starting to treat the housing market as an early-cycle recovery story, even as several commentators call for a cycle-ending recession. Not us though. We’ve been saying the economy can avoid a recession since last year, and we still believe that’s true.
This newsletter was written and produced by CWM, LLC. Content in this material is for general information only and not intended to provide specific advice or recommendations for any individual. All performance referenced is historical and is no guarantee of future results. All indices are unmanaged and may not be invested into directly. The views stated in this letter are not necessarily the opinion of any other named entity and should not be construed directly or indirectly as an offer to buy or sell any securities mentioned herein. Due to volatility within the markets mentioned, opinions are subject to change without notice. Information is based on sources believed to be reliable; however, their accuracy or completeness cannot be guaranteed. Past performance does not guarantee future results.
S&P 500 – A capitalization-weighted index of 500 stocks designed to measure performance of the broad domestic economy through changes in the aggregate market value of 500 stocks representing all major industries.
The NASDAQ 100 Index is a stock index of the 100 largest companies by market capitalization traded on NASDAQ Stock Market. The NASDAQ 100 Index includes publicly-traded companies from most sectors in the global economy, the major exception being financial services.
A diversified portfolio does not assure a profit or protect against loss in a declining market.
Compliance Case # 01772498


